
The Complex Picture of Caregivers’ Health and Well-Being in the Northeast Region
Introduction
This “Research Snapshot” explores the health and well-being of caregivers in the Northeast Region, as reported by households as part of the “NER-Stat: Caregiving Survey” — a regional household survey that the North Central Regional Center for Rural Development (NCRCRD) conducted in collaboration with Northeast Regional Center for Rural Development (NERCRD), The Ohio State University and the National Farm Medicine Center. The survey was conducted in 2023 with 4,480 responses from the 13 states of the Northeast Region through a Qualtrics online panel. Since the caregiving needs of children and adults vary, the researchers explored variations on supports used based on the type of care provided. The dataset that this brief draws upon is also available online here: https://purr.purdue.edu/publications/4491/1
- Learn more about this research and access other briefs in this caregiving series.
- Access a version of this brief that focuses on the North Central U.S.
- A printer-friendly version of this brief is available here.
Overview
Caregiving can be both a source of joy and stress for caregivers due to the lived realities of care provision and financial implications. In this brief, we explore the emotional and financial well-being of caregivers and assess differences across type of caregiving provided, gender, race-ethnicity, household income level, and geographic location.1 Overall, we find that caregiving has complex effects on caregivers. Many report that their caregiving is valued, and they enjoy caregiving. At the same time, the care they provide often comes at a cost to themselves and their households, ranging from negative effects on health and well-being to financial challenges. Caregiving had a more negative impact on caregivers of adults, caregivers of adults and children, women, people of color, low-income, and rural caregivers. The following provides greater details.
Caregivers’ Health and Well-Being
Three quarters of caregivers (76%) rated their health as “good” or higher. When asked about their happiness on a 0–10 scale where 10 is “extremely happy,” caregivers rated their happiness on average at 6.97.
Providing care can take a toll on caregivers. One-quarter of caregivers reported that caregiving worsened their mental or emotional health (26%) and social life (28%) while under one-fifth (14%) reported it worsened their physical health (Figure 1). Over half of caregivers responded that caregiving had no effect on their physical health (65%), mental or emotional health (51%), or social life (54%). Less than a quarter of caregivers reported that caregiving improved their physical health (20%), mental or emotional health (23%), or social life (18%).

Caregiving had different effects on health and well-being across caregiver characteristics.
Groups more likely to report that caregiving made their health and well-being worse included: caregivers of adults (both with and without children), as well as women, white, low-income, and non-urban caregivers. More specifically:
- While 14% of all caregivers reported that caregiving worsened their physical health, this proportion was higher for caregivers of adults and children (15%) and adults (20%; versus caregivers of children, 10%), women (16%; compared to men, 12%), non-Hispanic white (15%) and Hispanic (16%; compared to non-Hispanic people of color, though differences were not statistically significant), low-income (17%; compared to high-income, 10%), rural (16%) and suburban (17%; versus urban, 11%) caregivers.
- Though 26% of all caregivers reported that caregiving made their mental and/or emotional health worse, this was more pronounced among caregivers of adults and children (28%) and adults only (34%; versus 19% of respondents caring for children), women (29%; versus 21% of men), white (29%; compared to 23% of Hispanic and 24% of non-Hispanic people of color), low-income (28%; versus 22% of high-income), rural (28%), and suburban (30%; compared to 21% of urban) caregivers.
- Finally, 28% of all caregivers reported that caregiving had worsened their social life, but it was worse for some groups: caregivers of adults and children (30%) and of adults only (31%; versus 23% of caregivers of children), women (30%; versus 23% of men), white (30%; versus 28% of Hispanic and 24% of non-Hispanic people of color), middle-income (31%; versus 23% of high-income), rural (31%), and suburban (30%; versus 24% of urban) caregivers.
Caregivers experienced a range of feelings about the care they provide. Generally, these feelings were positive: caregivers agreed their caregiving is valued (66%), they enjoy caregiving (62%), they had a choice to become a caregiver (57%), and they feel supported as caregivers (55%) (Figure 2).

Feelings toward caregiving varied across caregiver characteristics. Groups less likely to have positive feelings toward care included: caregivers of adults, women, people of color, low-income, and non-urban caregivers.
- Two-thirds of all caregivers (66%) reported they felt their caregiving was valued. Women (64%; versus 70% of men), Hispanic (60%; versus 70% of white) and non-Hispanic people of color (65%), and low-income (63%; versus 71% of high-income) caregivers were less likely to feel valued. There were no differences by type of caregiving provided or rurality.
- Two-thirds of all caregivers (62%) reported that they enjoy caregiving, but this proportion was lower among caregivers of adults (54%; compared to 69% of caregivers of children and 64% of caregivers of both adults and children), women (61%), Hispanic (57%; compared to 65% of white) and non-Hispanic people of color (61%), and suburban (58%; versus 64% of urban) caregivers. There were no differences across income level.
- Three-fifths of all respondents (57%) reported feeling that they had a choice to become a caregiver. Yet, the following groups were less likely to report they had a choice: caregivers of adults (48%; versus 62% of caregivers of children and 60% of caregivers of both), women (55%; versus 61% of men), Hispanic (55%), low-income (55%; versus high-income, 64%), and rural and suburban (54%; versus 61% of urban) caregivers.
- One-half of all respondents (55%) reported that they felt supported in their caregiving role, but this proportion was lower among caregivers of adults (50%; compared to 59% of caregivers of children and 56% of caregivers of both), women (51%; versus 62% of men), Hispanic (51%), low-income (52%; versus 61% of high-income), and suburban (49%; versus 59% of urban) caregivers.
The Financial Cost of Caregiving
Caregiving often imposes a financial burden on those providing care. Over half of all caregivers (55%) reported experiencing financial difficulties due to providing or coordinating care, and over one-third of this group (38%) experienced three or more financial difficulties. The three most common difficulties were taking on debt (41%), missing or being late paying a bill (38%), and borrowing money (31%) (Figure 3).
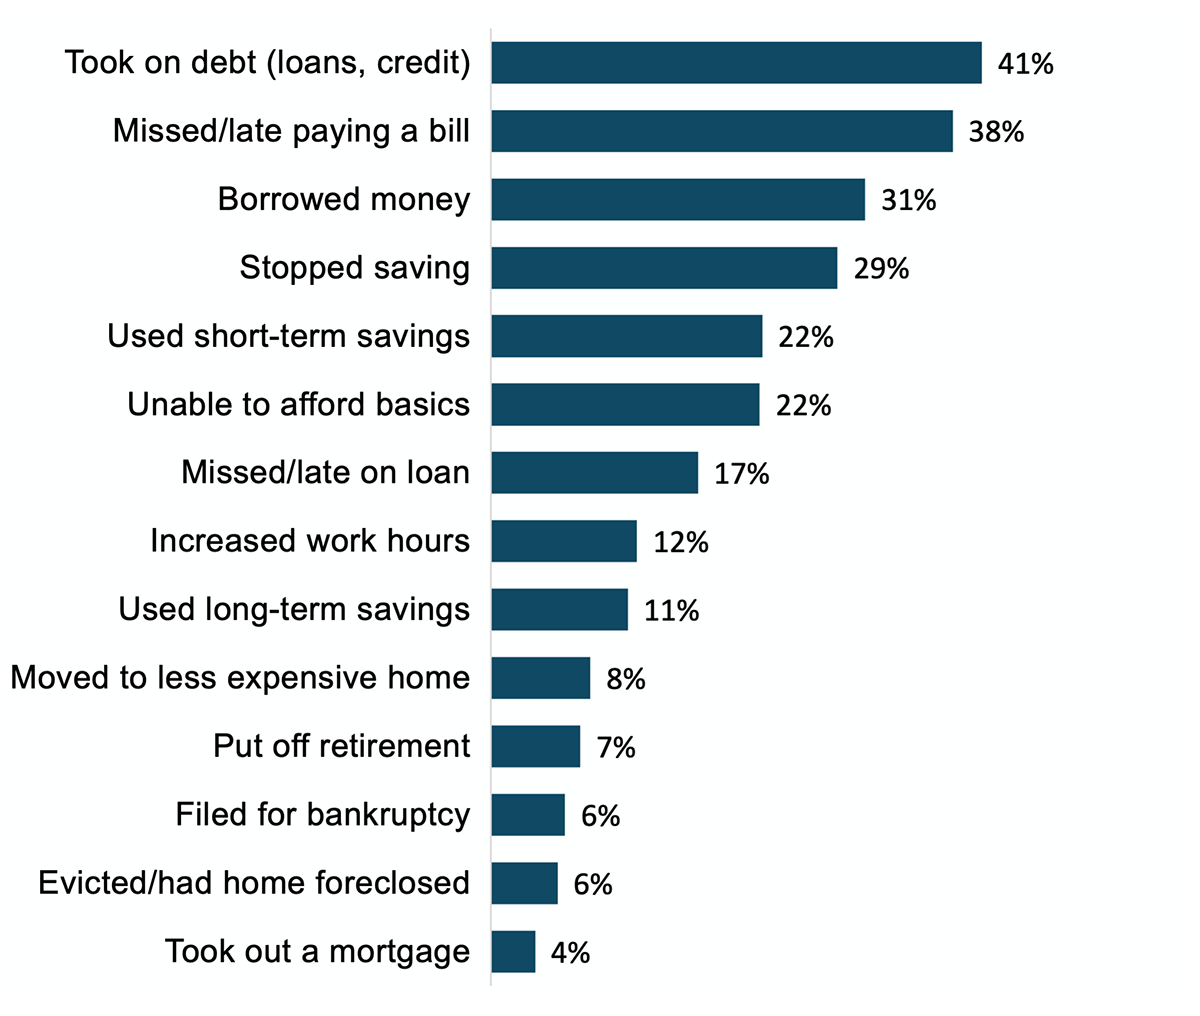
The financial burden of caregiving varied across caregiver characteristic. Such burdens were somewhat common, but some groups of caregivers experienced more difficulties: caregivers of children and adults, and Hispanic and urban caregivers.
- While half of caregivers (55%) reported financial difficulties due to caregiving, this proportion was higher for caregivers of children and adults (64%; versus caregivers of children, 49%, and caregivers of adults, 52%), Hispanic (65%, compared to 48% of white) and other people of color (58%), and urban (60%; versus 47% of rural) caregivers. There were no differences by gender or income level.
- Notably, caregivers of children and adults were often the most likely to report financial difficulties due to caregiving. For example, 43% reported having to take on more debt compared to 41% of all caregivers, while 39% reported missing a bill, compared to 38% of all caregivers.
Caregiving obligations often spilled over onto the paid work responsibilities of caregivers. One-third (37%) of caregivers reported that they had made changes to their employment because of caregiving. Of this group, almost half reduced their work hours or stopped working (42%), while one-third increased their hours or started working (33%) or switched jobs (22%) (Figure 4).
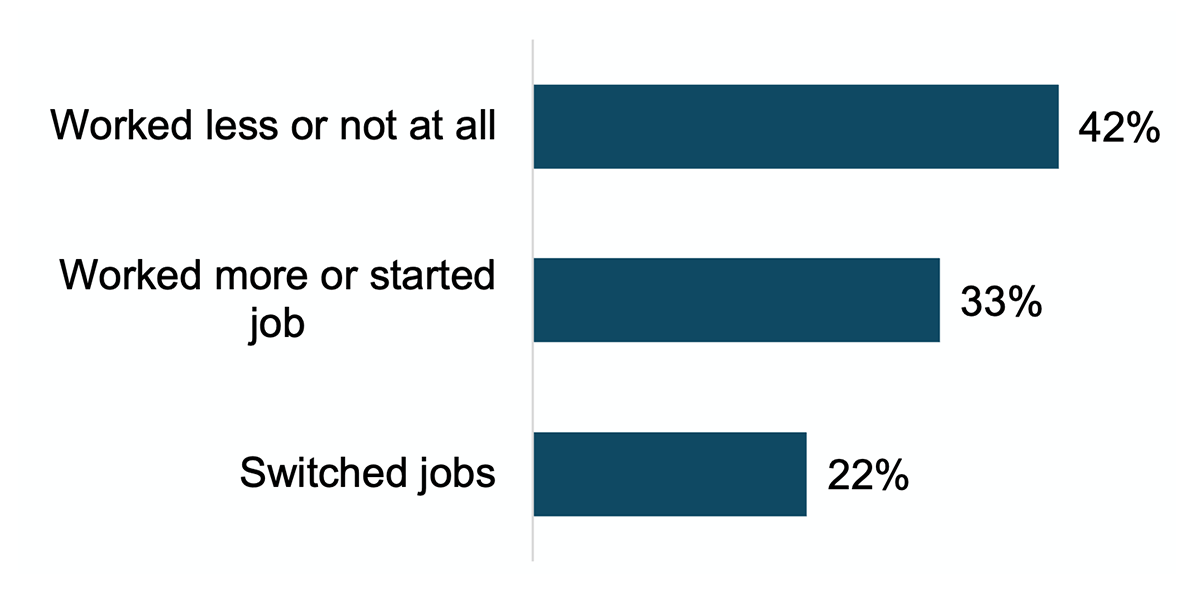
The impact of caregiving on caregivers’ paid work responsibilities was uneven. Some groups were more likely to make changes to their employment due to caregiving: caregivers of children and adults (46%; compared to 29% of caregivers of children and 34% of caregivers of adults), Hispanic (48%) and other caregivers of color (38%; compared to 29% of white caregivers), and suburban (39%) and urban (40%; versus 29% of rural) caregivers. There were no gender- or income-based differences.
Caregiving responsibilities affected caregivers’ ability to perform paid work. Almost half (48%) of all caregivers reported caregiving affects their ability to perform paid work “sometimes,” “often,” or “always” (Figure 5).
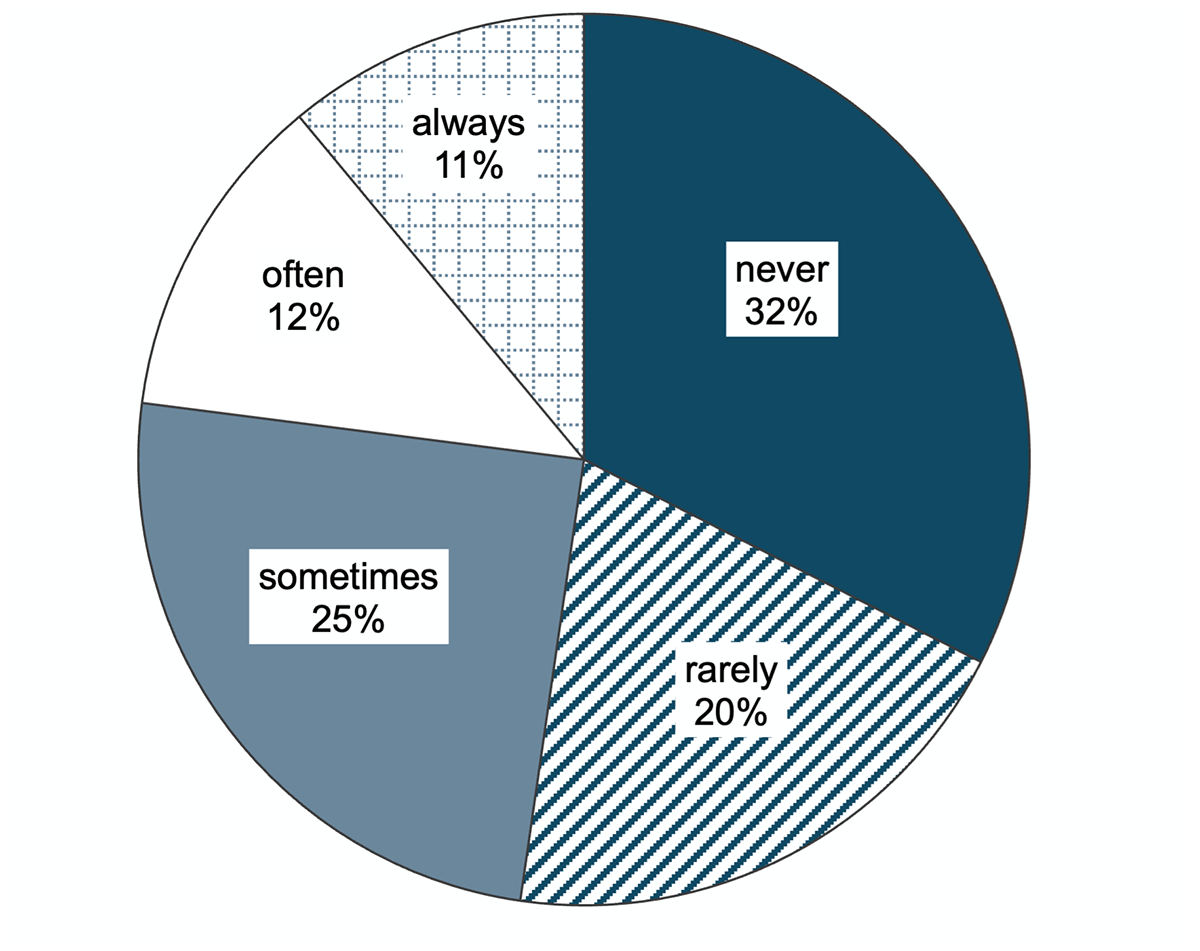
Caregiving affected the ability of some caregivers to perform paid work “sometimes” or more frequently. These groups were: caregivers of children and adults (56%; compared to 43% of caregivers of children and 42% of caregivers of adults), Hispanic (56%; compared to non-Hispanic white, 43%, and non-Hispanic caregivers of color, 45%), high-income (51%), and urban (50%; compared to 45% of rural) caregivers. There were no gender-based differences.
Finally, among those who reported leaving their job to be able to provide care, one-fourth (25%) expected they would be unable to return to the workforce in the future. Over one-third of caregivers of adults (35%) reported the same, compared to 17% of caregivers of both children and adults. Similarly, rural (38%) caregivers were more likely than urban (18%) caregivers to report the same. It is notable that there were no differences across caregiver gender, race-ethnicity, or income level.
Footnotes
1 Type of caregiving provided means caring for children only, caring for adults only, or caring for both children and adults. Gender captures men and women. Race-ethnicity captures non-Hispanic white, Hispanic, and non-Hispanic people of color. Household income level captures low-income (less than $50,000, between $50,000 and $100,000, or more than $100,000). Geographic location measures a self-report of living in a rural, suburban, or urban area. We report comparisons that are statistically significant at the p<0.05 level. Return to text.
About this research
Suggested citation
Pojman, E., Becot, F., Inwood, S. (2024, October 18). The Complex Picture of Caregivers’ Health and Well-Being in the Northeast Region. Research Brief. Northeast Regional Center for Rural Development. doi: 10.22004/ag.econ.347372.
Authors
Elena Pojman, Penn State, emp5761@psu.edu; Florence Becot, Penn State, florence.becot@psu.edu Shoshanah Inwood, The Ohio State University, inwood.2@osu.edu.
Methods and dataset
The survey was conducted in 2023 with 4,480 responses from the 13 states of the Northeast Region through a Qualtrics online panel. NER-Stat: Caregiving Survey is the regional household survey that the North Central Regional Center for Rural Development (NCRCRD) conducted in collaboration with Northeast Regional Center for Rural Development (NERCRD), The Ohio State University and the National Farm Medicine Center. NCRCRD has also previously conducted the NCR-Stat: Caregiving survey in the North Central Region. The technical documentation, survey codebook, and the open access dataset are available for download here: Inwood, S.; Bednarik, Z.; Becot, F.; Caldera, S.; Henning-Smith, C.; Cohen, S.; Finders, J.; Brown, L. (2024). Northeast Region Household Data. NER-Stat: Caregiving Survey. Purdue University Research Repository. doi:10.4231/TP7N-8B10.
Funding Acknowledgement
This research was supported in part by the Northeast Regional Center for Rural Development and the North Central Regional Center for Rural Development, two of the nation’s four Regional Rural Development Centers (RRDCs). The RRDCs are funded by U.S. Congress through the U.S. Department of Agriculture National Institute of Food and Agriculture’s annual appropriations process. The NERCRD also receives funding from Hatch/Multi-State Appropriations under Project #PEN04802 and Accession #7003365, the Northeastern Regional Association of State Agricultural Experiment Station Directors, and the Pennsylvania State University, College of Agricultural Sciences. Any opinions are solely those of the authors.
Authors: Elena Pojman, Florence Becot, and Shoshanah Inwood
Publication: Published by NERCRD Date Published: October 17, 2024