Location-Quotients and TRED
February 27, 2024
by Steven Deller, University of Wisconsin
(Click here to return to the TRED Table of Contents.)
Methods of identifying potential industries to focus targeting efforts on vary widely, but an approach suggested by Harvard business economist Michael Porter is growing in popularity. The approach is built on the notion of location quotients and it includes current values of the location quotient, changes in the location quotient over time, and the relative size of the industry coupled with other industry characteristics. The location quotient (LQ) is an indicator of self-sufficiency, or relative strength, of a particular industry. The LQ is computed as:
Percent of local economic activity in sector i
LQis = ——————————————-
Percent of National Economic activity in sector i
or mathematically, if we let economic activity be represented by e with i denoting the sector in community s or in the nation n, this is equivalent to:
LQis = (eis /ets ) /(ein /etn )
The proportion of national economic activity in sector i located in the region (state or community) measures the region’s production of product i, assuming the same labor productivity everywhere. The proportion of national economic activity in the region is a proxy for local consumption, assuming equal consumption per worker. The difference between local production and consumption is an estimate of production for export (i.e., production > consumption).
The key assumptions needed to operationalize the location quotient approach are that the regional production technology is identical to national production technology (i.e. equal labor productivity) and that local tastes and preferences are identical to national tastes and preferences (i.e., equal consumption per worker). Assuming the national economy is self-sufficient, the comparison between the community and the national benchmark gives an indication of the degree of specialization or self-sufficiency.
Three important location quotient values derive from the self-sufficiency interpretation of location quotients. A location quotient of one (1.0) means the region has the same proportion of economic activity in sector i as does the nation. The region just meets its local consumption requirements through local production of the specified good or service. If the location quotient is less than one, the region is not producing enough to meet local needs. If the location quotient is greater than one, the region has a larger proportion of its economy in sector i than does the nation, and the excess can potentially be exported.
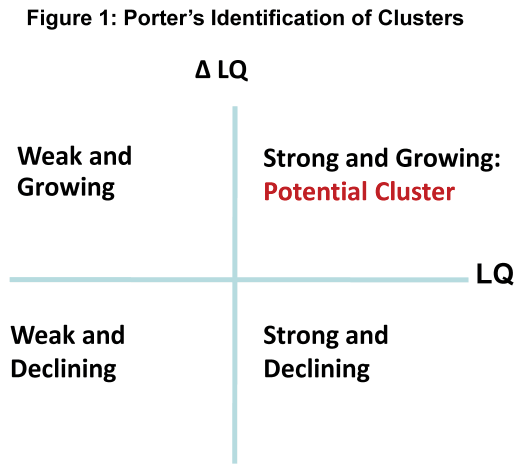
The Porter notion of clusters, or in our case industrial sectors that warrant attention for targeting efforts, evaluates levels and changes of the location quotient coupled with the absolute size of the industry and other characteristics that may make the industry desirable as a source of employment opportunities. Consider the simple mapping of the level and change of the LQ in Figure 1. There are four potential combinations.
First, if the industry has a LQ of less than one and it is declining over time, this industry is considered to be a “weak and declining” industry and generally should not be considered a potential cluster. Second, if the LQ is less than one but increasing over time, the industry can be considered a “weak and growing” industry and it may be a potential industry of focus for economic targeting efforts. Third, if the LQ is greater than one but is declining over time, it is considered “strong and declining.” Industries in this category might be considered at risk and deserving of special consideration to understand why a strong industry (i.e. LQ>1) is weakening (i.e. LQ<0). In particular, does the decline of these industries present a potential risk to the regional economy? Fourth, if the LQ is greater than one and growing over time, it is considered “strong and growing.” Porter suggests that industries in this category are potential clusters for economic growth and development and should be the focus of targeting efforts. These industries have self-identified the region as having a competitive advantage over other regions and may have further growth potential.
There are several ways in which to measure economic activity, including employment, sales and income. For several reasons, employment is the most commonly used. First, the U.S. Economic Development Administration has embraced Porter’s approach to identifying clusters and has provided numerous tools, all of which are based on employment. Second, employment data are generally more readily available in a timely manner than sales or income data. Third, employment data are available not only at the national and state level but also at the county level. The employment metric, however, may in practice show weakening of some sectors over time — even though we know the sector is growing in terms of sales. This raises the question of what are the best measures of economic growth and development. The answer to this question can drive economic policy.
Another difficulty in applying the location quotient approach as outlined in Figure 1 is that threshold levels are difficult to interpret. Suppose, for example, that a location quotient for a particular industry changes from 1.7 to 1.6 over the study period; is this decline “significant” enough to remove the industry from potential future consideration? Alternatively, suppose that a local industry has a large and increasing location quotient but employs less than two percent of the region’s total employment; is this sector too small for future consideration? Further, what if a local industry is large in terms of the share of total employment attributed to that industry, and has a large and growing location quotient but pays substandard wages? It is important that analysts using location quotients as suggested by Porter consider local knowledge of the industry as well as broader goals of the community.
Further details are provided in the accompanying edited volume (Targeting Regional Economic Development, chapter 4).

